How to Read an HPLC Chromatogram: Retention, Area and Resolution
Read two synthetic HPLC traces, find retention times and integration bases, and compare overlapping peaks with a worked resolution example.
Read retention time on the horizontal axis and detector response on the vertical axis. Check how the method assigns the target peak and which signals the integration includes. A large peak can contain more than one component if the separation leaves them unresolved.
Read the axes and identify the run
An HPLC chromatogram usually plots detector response against elapsed time, commonly in minutes. For an ultraviolet detector the response may be in milli-absorbance units (mAU) at a specified wavelength. Peak area is integrated over time, so the peak table may use mAU·s or another signal–time unit. Match the plot’s sample ID and injection number to the run of interest. A blank, reference injection and test sample can appear together in a report and each serves a different purpose.
Retention time depends on the method. A reversed-phase separation depends on the column, mobile phases and gradient, temperature, flow and other conditions. Compare the target peak with an appropriate reference run under the same method, or use a method-defined relative retention criterion. Retention agreement provides one piece of evidence for peak assignment. Other components can elute in the same time window.
EMA, Synthetic peptides guideline, §§ 2, 4.1, 4.3 and 4.4 · ICH Q2(R2), Validation of Analytical Procedures, corrected April 2025
Recalculate the area percentage
In a fictional UV run, the included peaks have areas of 930, 50 and 20 mAU·s. The main peak represents 930 ÷ 1,000 × 100 = 93.0% of the included area. If a documented reporting rule excludes the 20 mAU·s feature, the denominator becomes 980 mAU·s and the displayed percentage rises to 94.9%. The two percentages describe the same measured trace under different integration rules. Find out whether peaks were excluded as blank or solvent signals, by a reporting threshold or for another documented reason.
The baseline and integration boundaries affect the areas. Ask for the peak table and the trace with integration marks, especially when the baseline drifts or the main peak has a shoulder. Detector response can also differ by component. If two equal-mass components yield 100 and 50 area units under the stated settings, the stronger responder contributes two-thirds of the combined area while the two masses are equal.
Check the separation of neighboring peaks
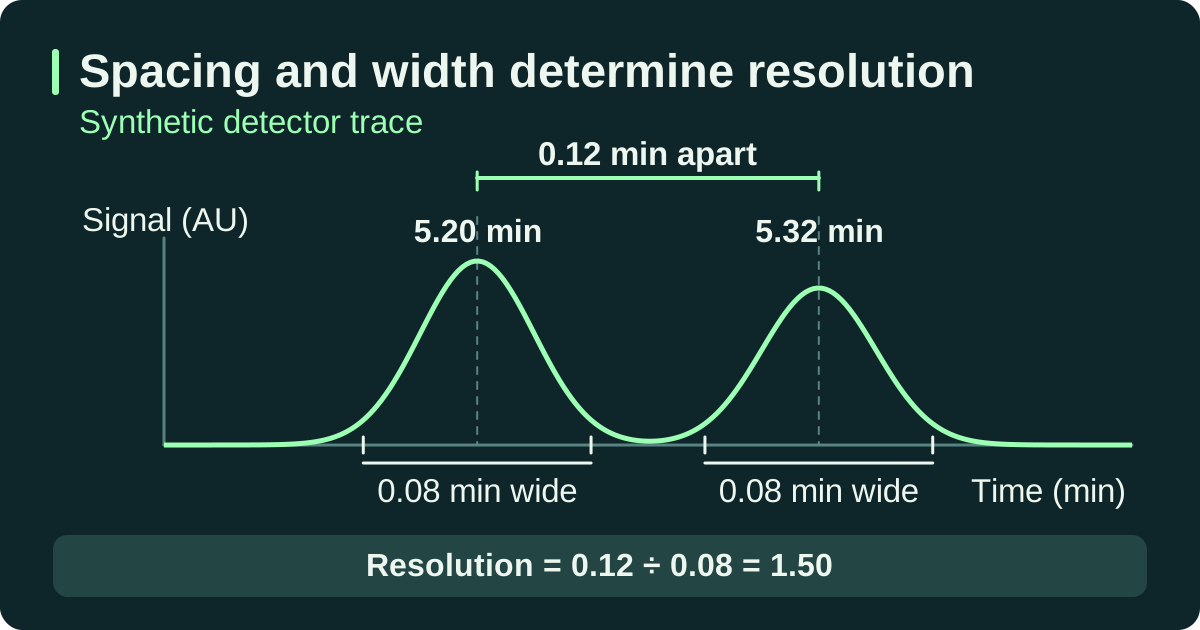
IUPAC defines chromatographic resolution using the difference in retention times divided by the average of the two baseline peak widths. For two resolved peaks centered at 5.20 and 5.32 min, each 0.08 min wide at the baseline, resolution is 0.12 ÷ 0.08 = 1.50. Use the same width definition throughout the calculation. Methods that use widths at half height use the corresponding formula. Whether a measured resolution is acceptable depends on the method’s requirement for that peak pair.
A visually symmetric peak can still conceal co-elution. Where an overlapping impurity matters, look for evidence from a reference mixture, another separation or an additional detection technique appropriate to the question. The absence of a shoulder alone supplies little evidence about separation from a particular impurity.
Keep the full trace, annotated peak table, method and revision, detector settings, any relevant reference and the system suitability result. An audit note can name the target peak and assignment evidence, state the denominator used and describe any unresolved peak pair. Compare reported percentages across runs only after checking that method settings and reporting rules are comparable.
If your conclusion depends on quantifying a small peak or applying the method to a new matrix, check the validation evidence for the reportable range and matrix.
IUPAC Gold Book, Peak resolution in chromatography · ICH Q2(R2), Validation of Analytical Procedures, corrected April 2025
Compare two modeled traces
The two cases keep the component heights and widths fixed and change only their separation. Use the same trace settings in the explorer to reproduce the results.
Both fictional chromatograms plot relative detector signal in arbitrary units (AU) against time in minutes. The dashed curves show the individual components, with a longer dash for peak 1. The solid line shows their summed signal.
| Trace | Peak centers tR (min) | Shared σ / baseline width (min) | Component areas (AU·min) | Model Rₛ |
|---|---|---|---|---|
| A · Wider separation | 3.00 / 4.60 | 0.35 / 1.40 | 0.8773 / 0.6141 | 1.14 |
| B · Overlapping peaks | 3.00 / 3.50 | 0.35 / 1.40 | 0.8773 / 0.6141 | 0.36 |
The model uses Gaussian peaks with heights of 1.00 and 0.70 AU. The baseline-width convention is 4σ. The areas integrate each full modeled component, using height × σ × √(2π). Trace B has the same component areas by construction. An analyst working from its combined signal would need a justified way to separate them before reporting individual areas.