Download the synthetic traces
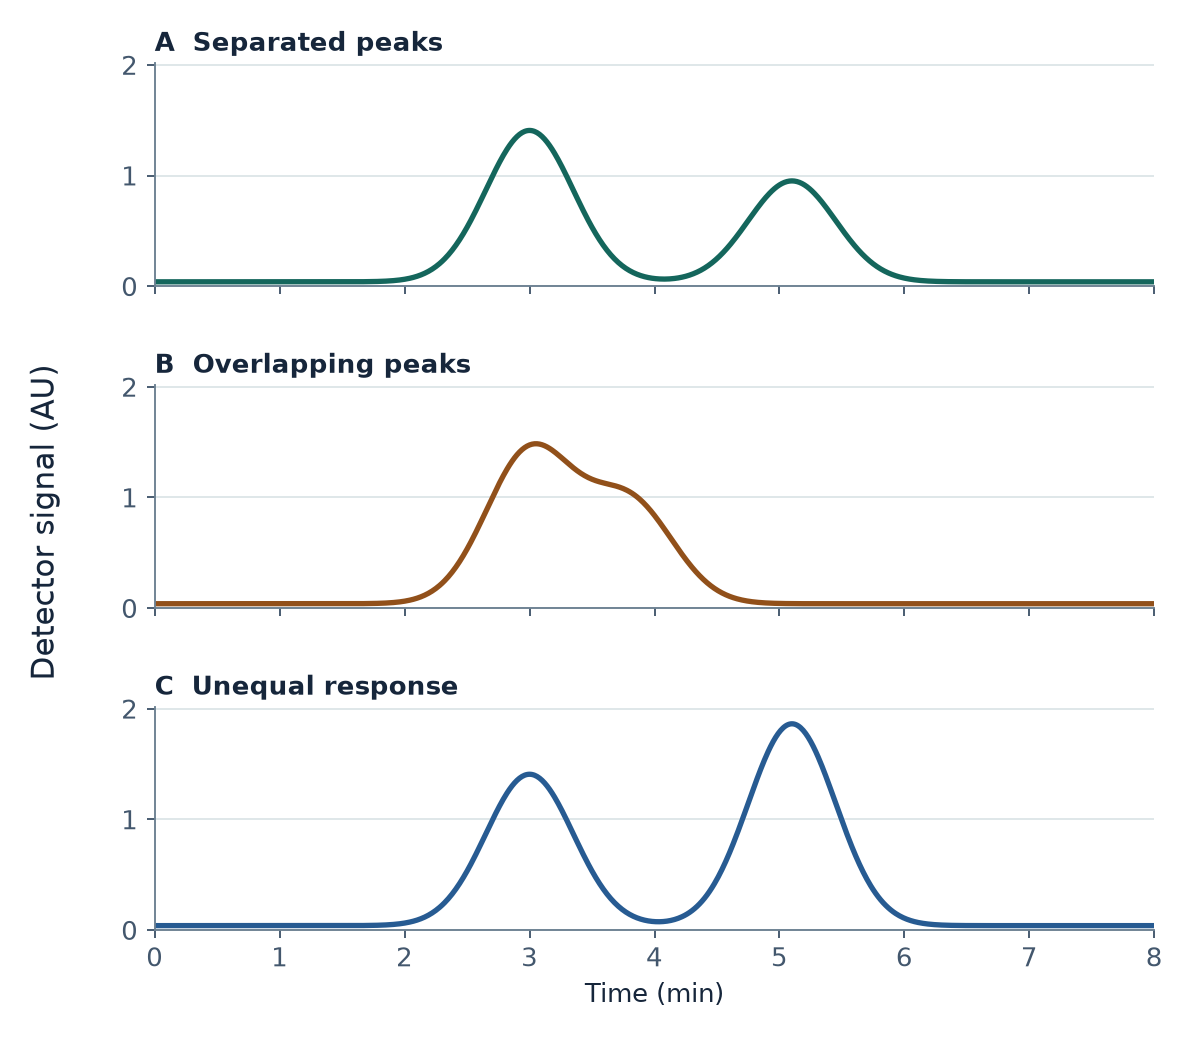
- Case A · Separated peaks (CSV)
Reference separation with equal detector response. - Case B · Overlapping peaks (CSV)
Closer retention times with equal detector response. - Case C · Unequal response (CSV)
Reference separation with a stronger response from the later component.
Each file has 801 rows sampled from 0.00 to 8.00 min in 0.01 min steps. The UTF-8 CSVs use comma delimiters and decimal points. Each file contains the simulated detector signal before baseline correction, with no component columns.
| Column | Meaning |
|---|---|
time_min | Time since the simulated run began, in minutes. |
detector_signal_au | Summed synthetic detector signal in arbitrary units (AU), including the 0.040 AU baseline. |
Use it in class
Students need basic graph reading, spreadsheet formulas and access to an XY plot or equivalent. The activity uses a spreadsheet or a scripting tool and requires no instrument or account.
- Calculate chromatographic resolution from supplied model retention times and baseline widths.
- Integrate a baseline-corrected detector trace and test how a split changes the assigned areas.
- Use known response factors to estimate the composition of the two simulated components.
Open the printable student worksheet or open the instructor guide with worked answers.
Provenance and reuse
Two ideal Gaussian signals and a constant baseline generate each trace. The cases omit noise, drift and tailing. The data represent no sample or instrument measurement.
Peak & Mass is a ChemVerify-affiliated educational publication. The original teaching material, figures and synthetic data are available under CC BY 4.0. The reuse notice includes suggested attribution.